Project Brief
ZentriPulse
AI-Powered Patient Insights Dashboard
Conceptual Product Design Case Study
Overview
ZentriPulse is a conceptual clinician-facing dashboard designed to transform continuous wearable cardiac data into prioritized, actionable insights.
The platform leverages AI-assisted risk modeling to help healthcare providers quickly identify high-risk patients, reduce cognitive overload, and make informed care decisions in remote monitoring environments.
This project explores how AI-enhanced data visualization and workflow design can improve safety, efficiency, and clarity in digital health systems.
The Problem
Remote patient monitoring devices collect thousands of biometric data points per patient per day, including:
- Heart rate
- Heart rate variability (HRV)
- Arrhythmia events
- Activity levels
- Sleep metrics
While existing platforms display raw metrics and alerts, clinicians often face:
- Alert fatigue from excessive notifications
- Difficulty prioritizing patients by meaningful risk levels
- Cognitive overload from scanning multiple data streams
- Limited transparency into how AI-generated risk scores are calculated
In high-volume clinical environments, these challenges increase the risk of missed critical events and inefficient care coordination.
The Opportunity
Design a dashboard experience that:
- Prioritizes patients using interpretable AI-driven risk indicators
- Explains how risk scores are generated
- Reduces clinician cognitive load
- Supports coordinated care workflows
- Meets accessibility and healthcare compliance standards
Target Users
Primary User
Cardiologists and clinical specialists managing remote cardiac patients.
Needs:
- Quickly identify high-risk individuals
- Trust AI-assisted recommendations
- Review trends without scanning raw data
Secondary User
Care coordinators responsible for outreach and follow-up.
Needs:
- View flagged patients
- Track outreach status
- Document interventions
Goals
- Reduce time required to identify high-risk patients
- Improve clarity and trust in AI-assisted insights
- Minimize alert fatigue
- Provide clear documentation and auditability
- Ensure WCAG-accessible, responsive design
- Constraints & Considerations
- HIPAA-compliant data handling
- Clinical audit trails
- AI explainability and confidence scoring
- Risk mitigation for false positives and false negatives
- High-volume data environment
- Accessibility (WCAG AA minimum)
- Cross-device responsiveness (desktop + tablet)
Core Concept
ZentriPulse introduces an AI-powered risk layer that:
- Continuously analyzes biometric data streams
- Generates a dynamic patient risk score (0–100)
- Surfaces contributing risk factors
- Highlights deviations from baseline
- Displays AI confidence level
Instead of presenting raw data alone, ZentriPulse transforms complexity into prioritized clinical insight.
Key Features
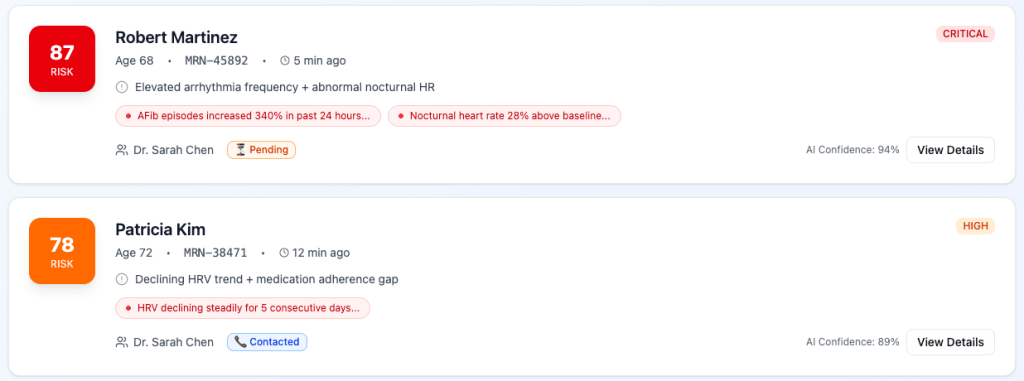
- Risk-Based Patient Prioritization
- Sortable dashboard ranking patients by severity and urgency.
- Explainable AI Panel
- Breakdown of risk score contributors:
- Arrhythmia frequency change
- HRV trend shift
- Abnormal nocturnal heart rate
- Activity deviation
- Includes confidence score and last-updated timestamp.
- Trend Visualization
- Clear, minimal graphs with:
- Baseline overlay
- Highlighted anomaly periods
- Filter controls
- Alert Management
- Alert history
- Resolved vs active
- Override and documentation tools
- Care Coordination Panel
- Outreach status
- Assigned staff
- Intervention notes
- Follow-up scheduling
My Role
UX/Product Designer
- Concept generation and development
- Research synthesis
- Persona creation
- Journey mapping
- User flow charts
- Wireframing and high-fidelity prototyping
AI tools such as ChatGPT and Figma Make were used as collaborative partners to accelerate workflow, explore risks, generate edge cases, and stress-test AI risk logic. All final product decisions were human-led.
Persona Creation
Figma Make generated a primary user persona and a secondary user persona for the project, synthesizing research to include goals, needs, pain points, and quotes that would be typical of these types of users in the healthcare industry.
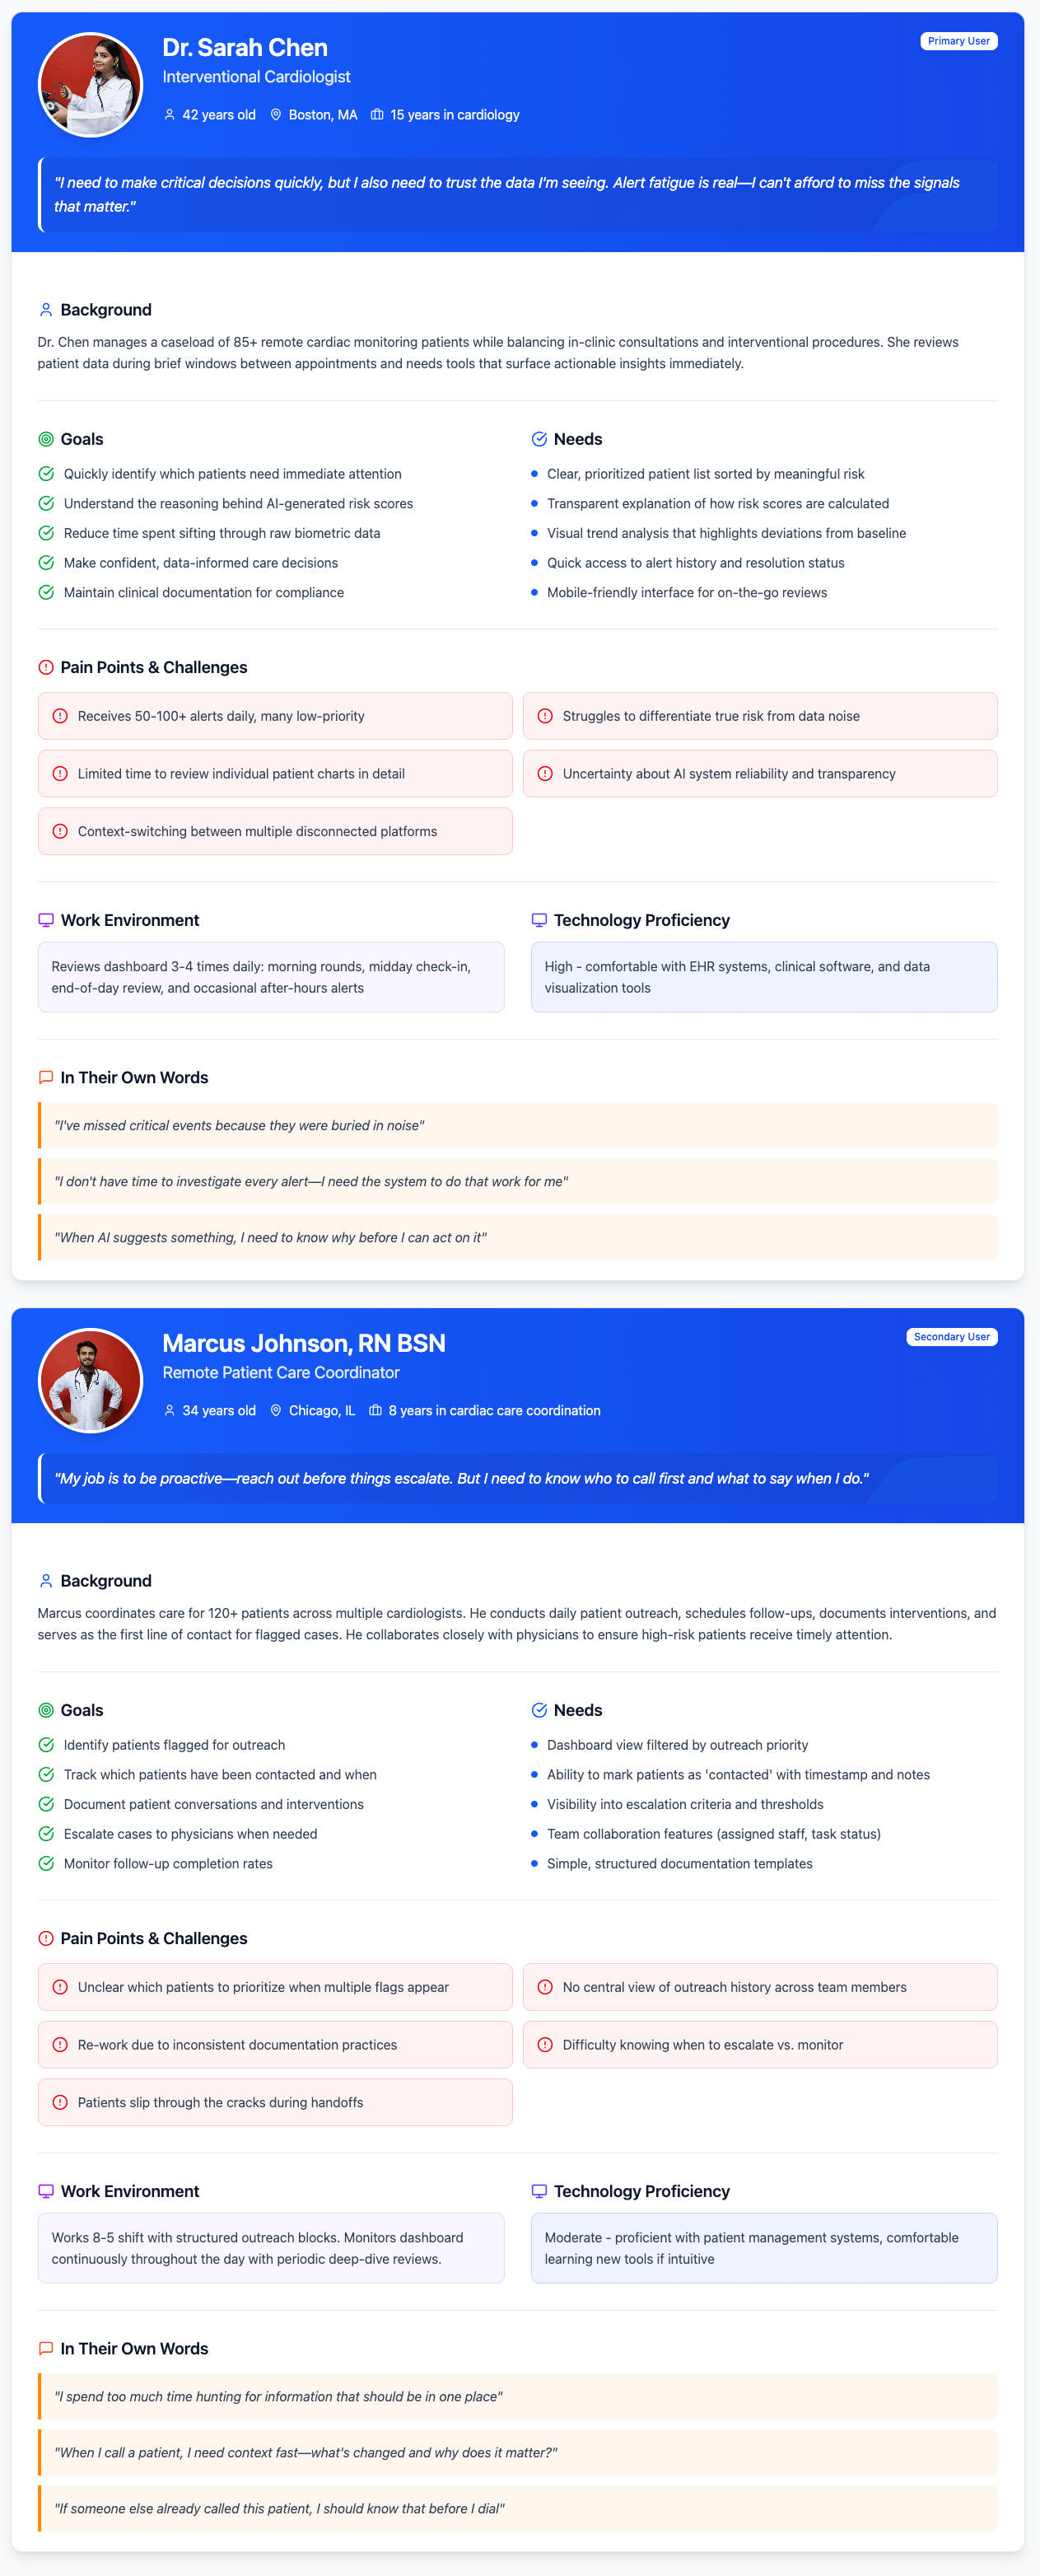
Personas as a downloadable PDF
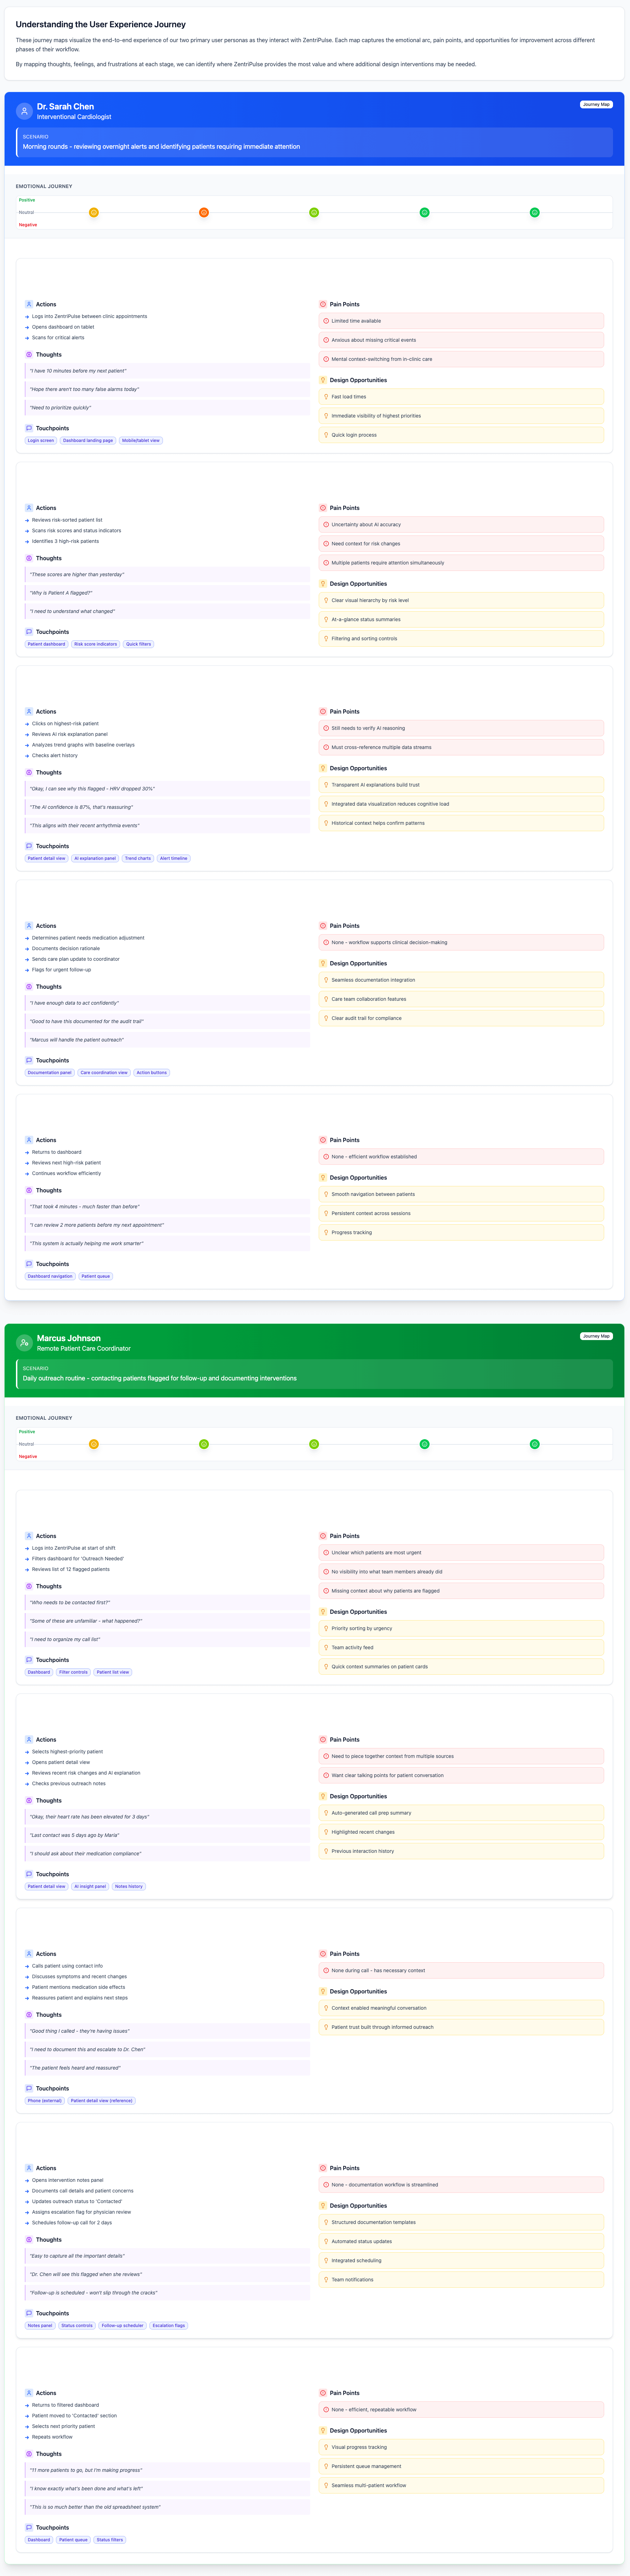
Journey Mapping
Journey maps for my personas were generated using AI, providing me with realistic and believable emotions, actions, thoughts, pain points, and opportunities.
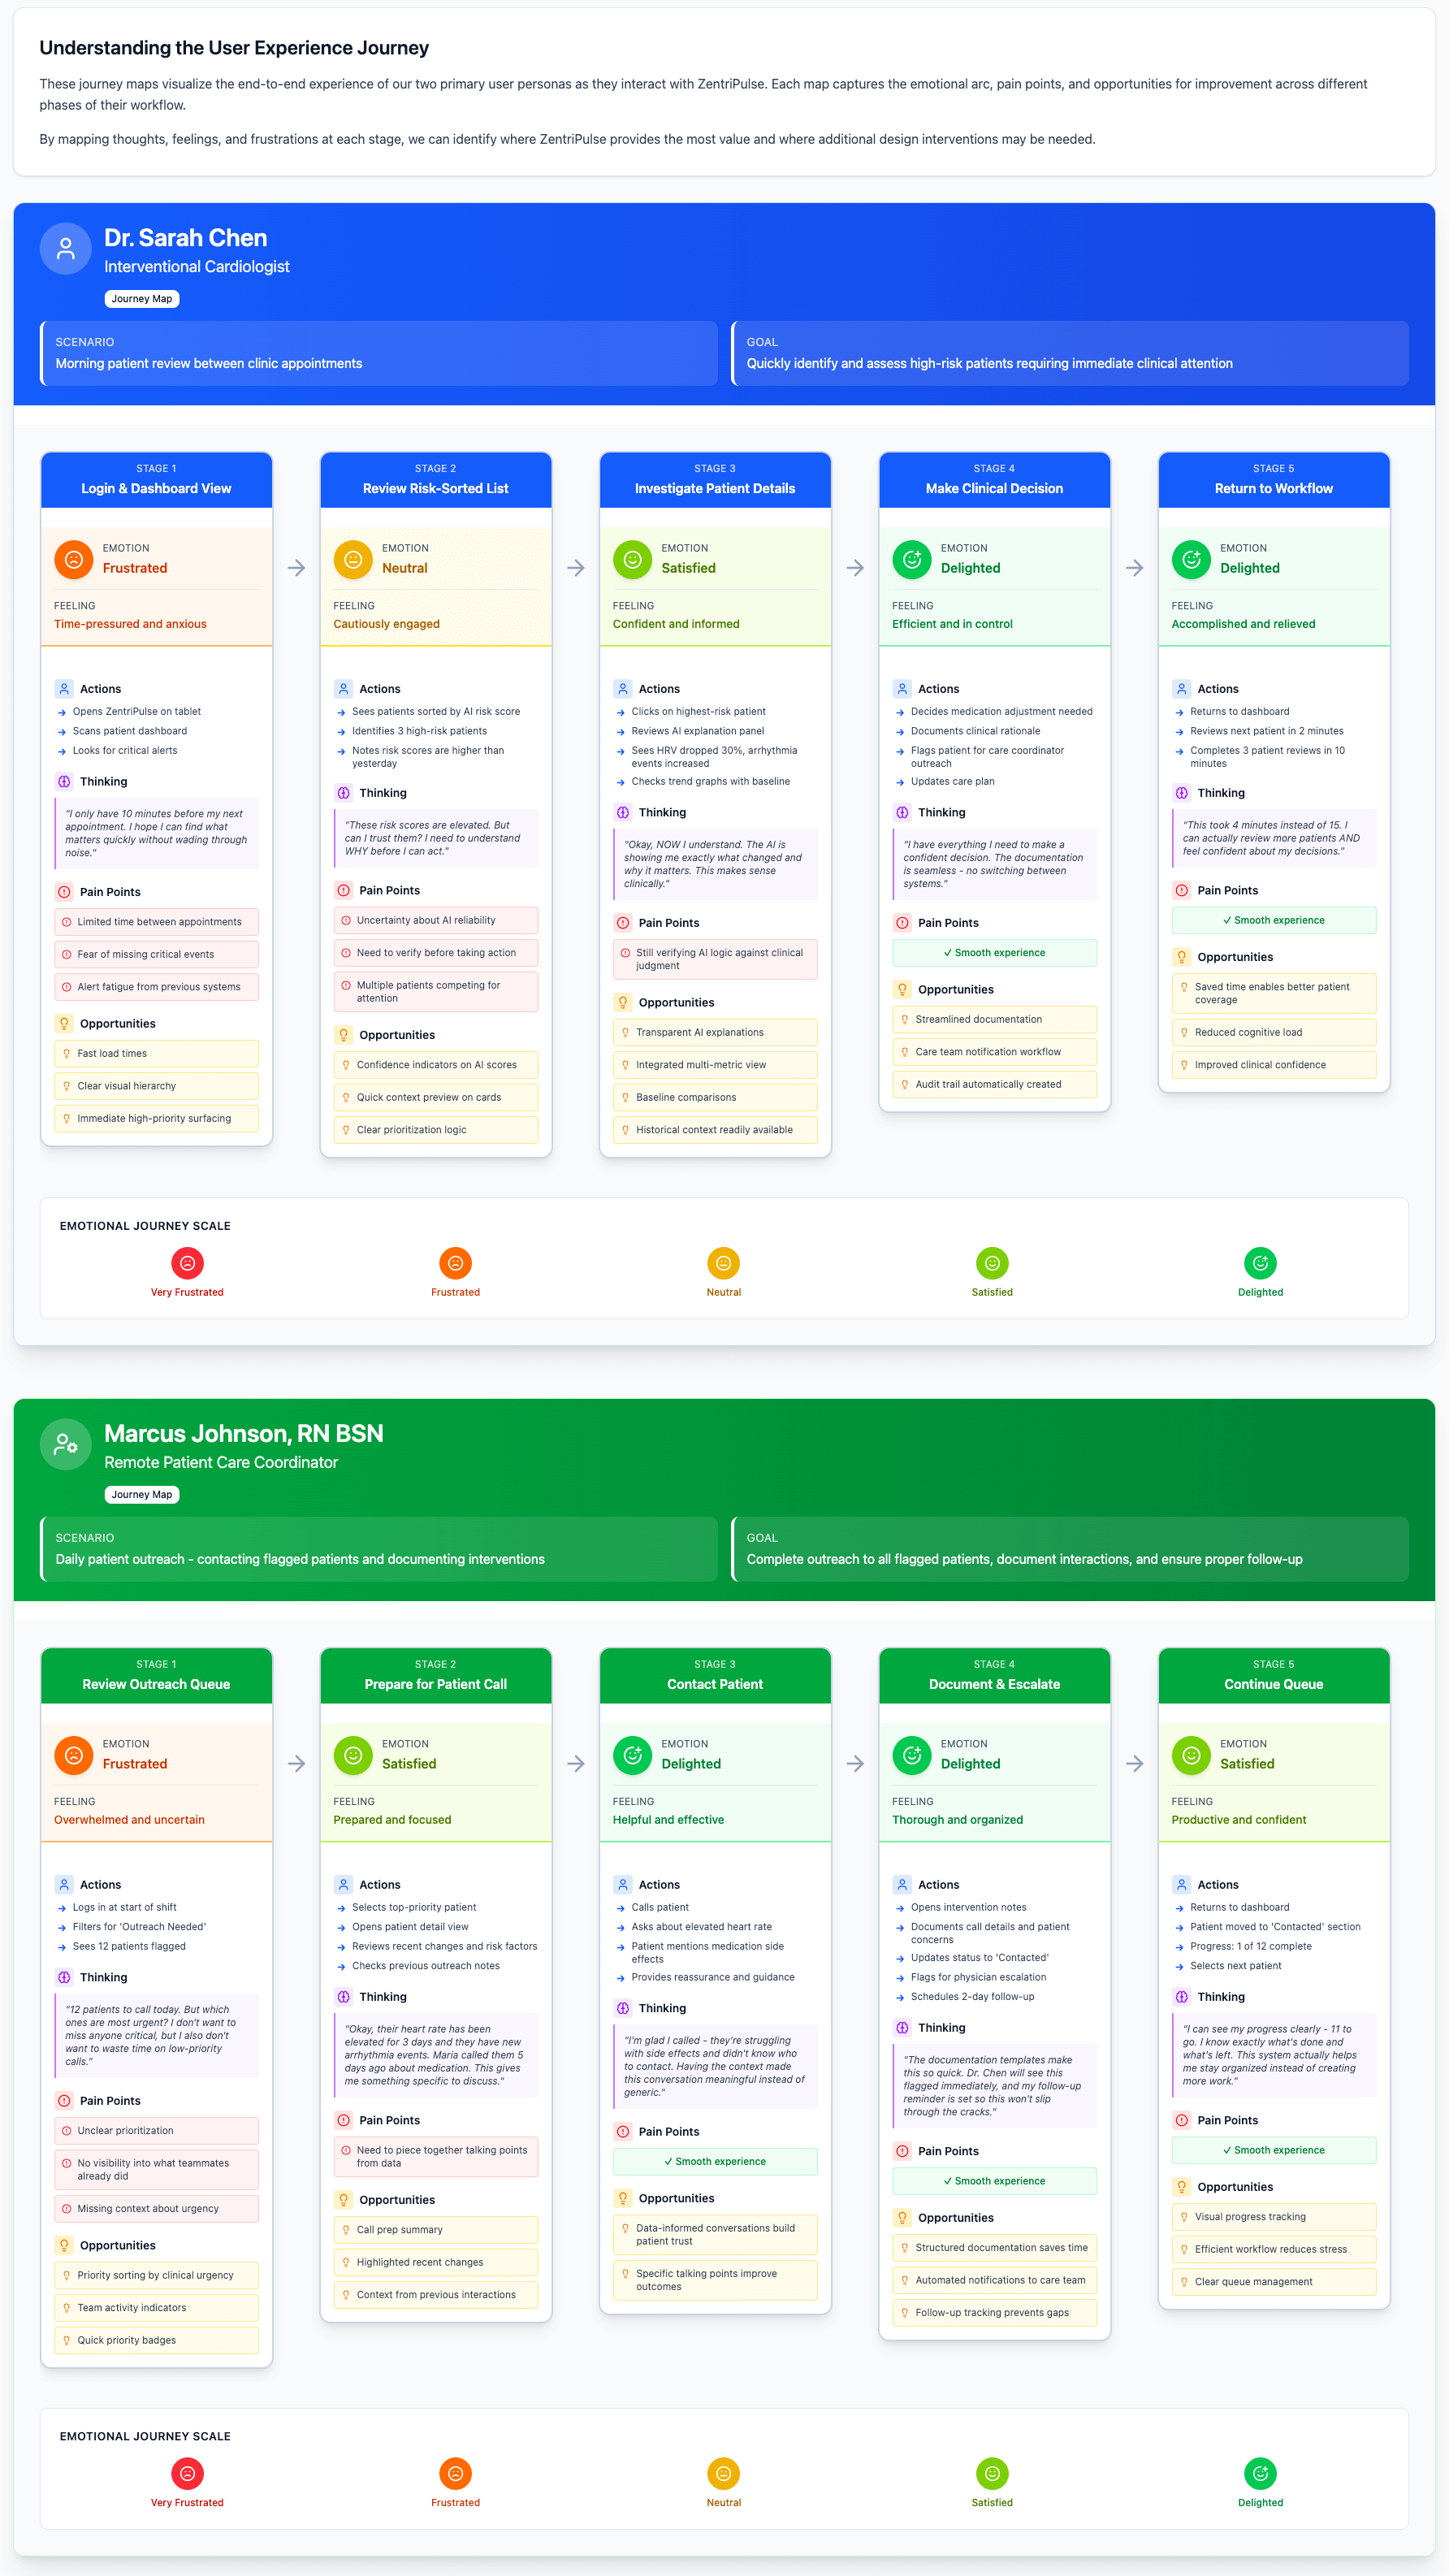
Journey Maps as a downloadable PDF
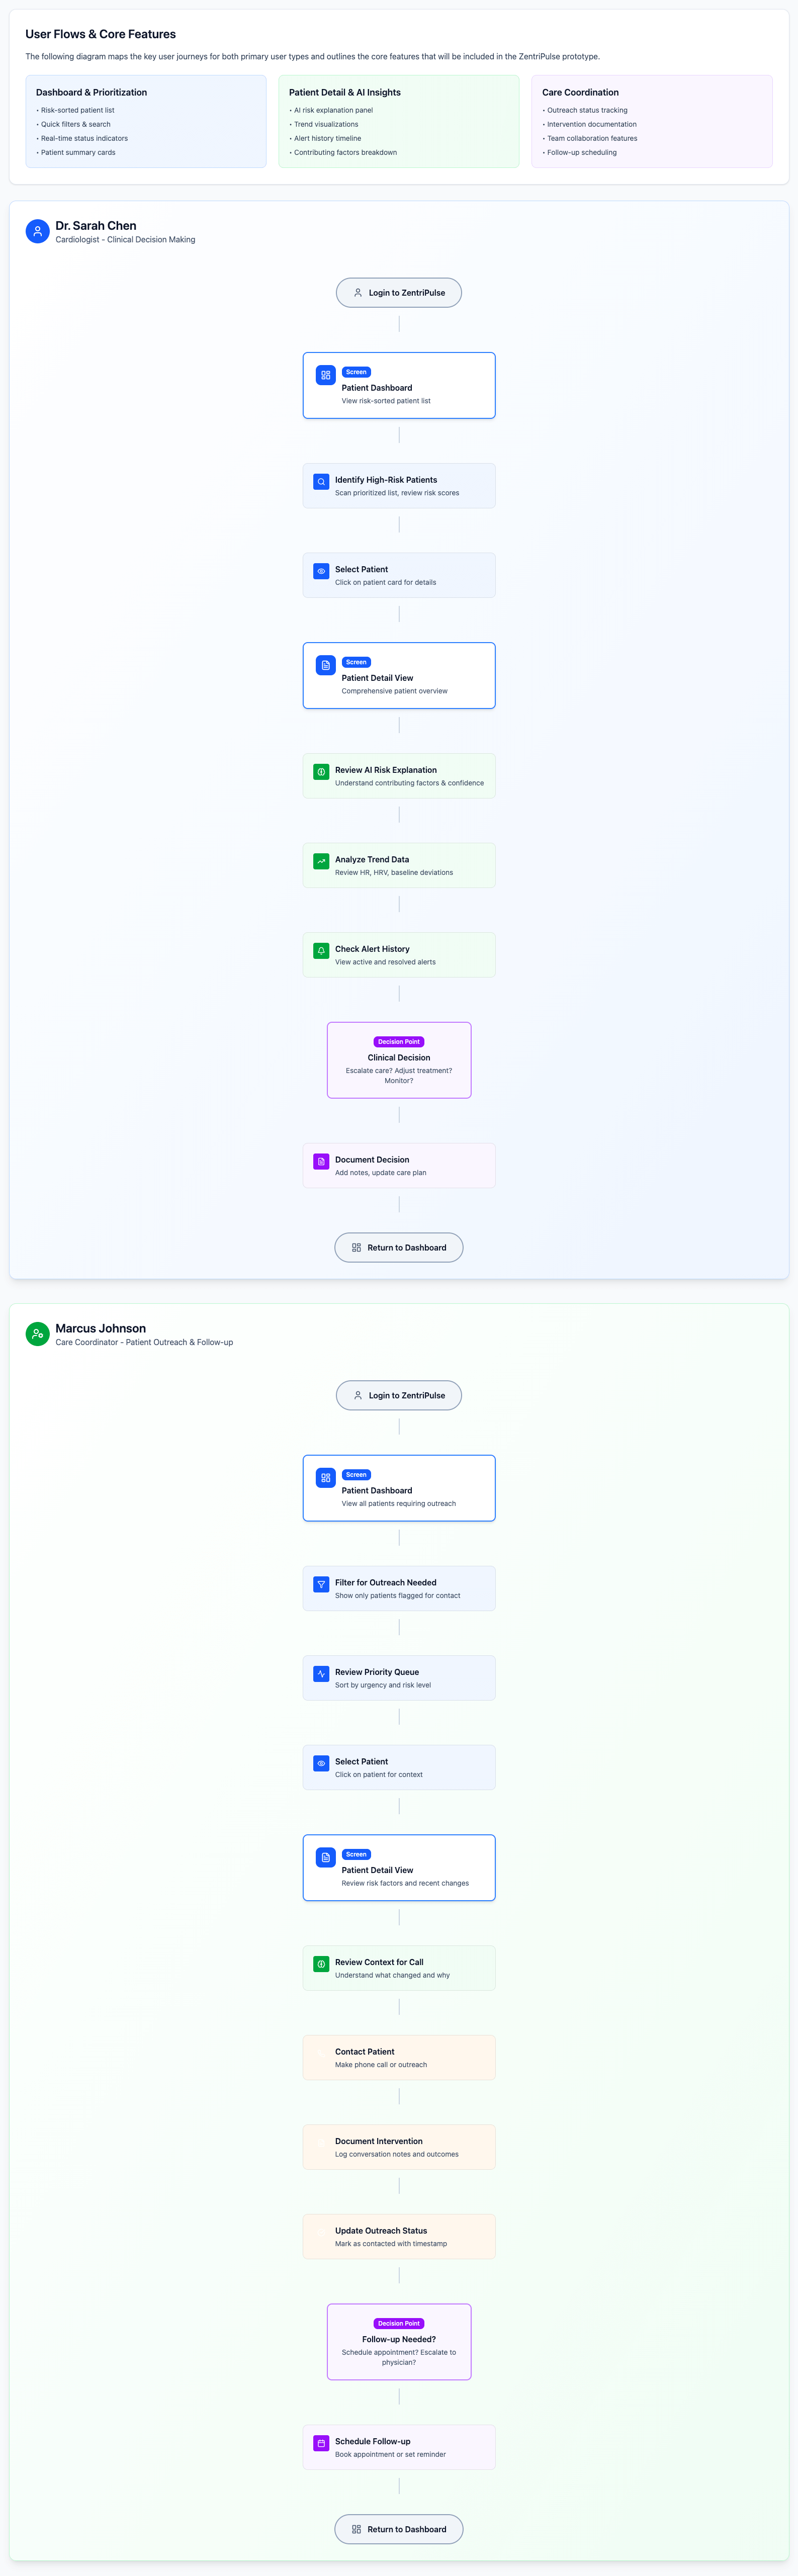
User Flow
Low-Fidelity Wireframes
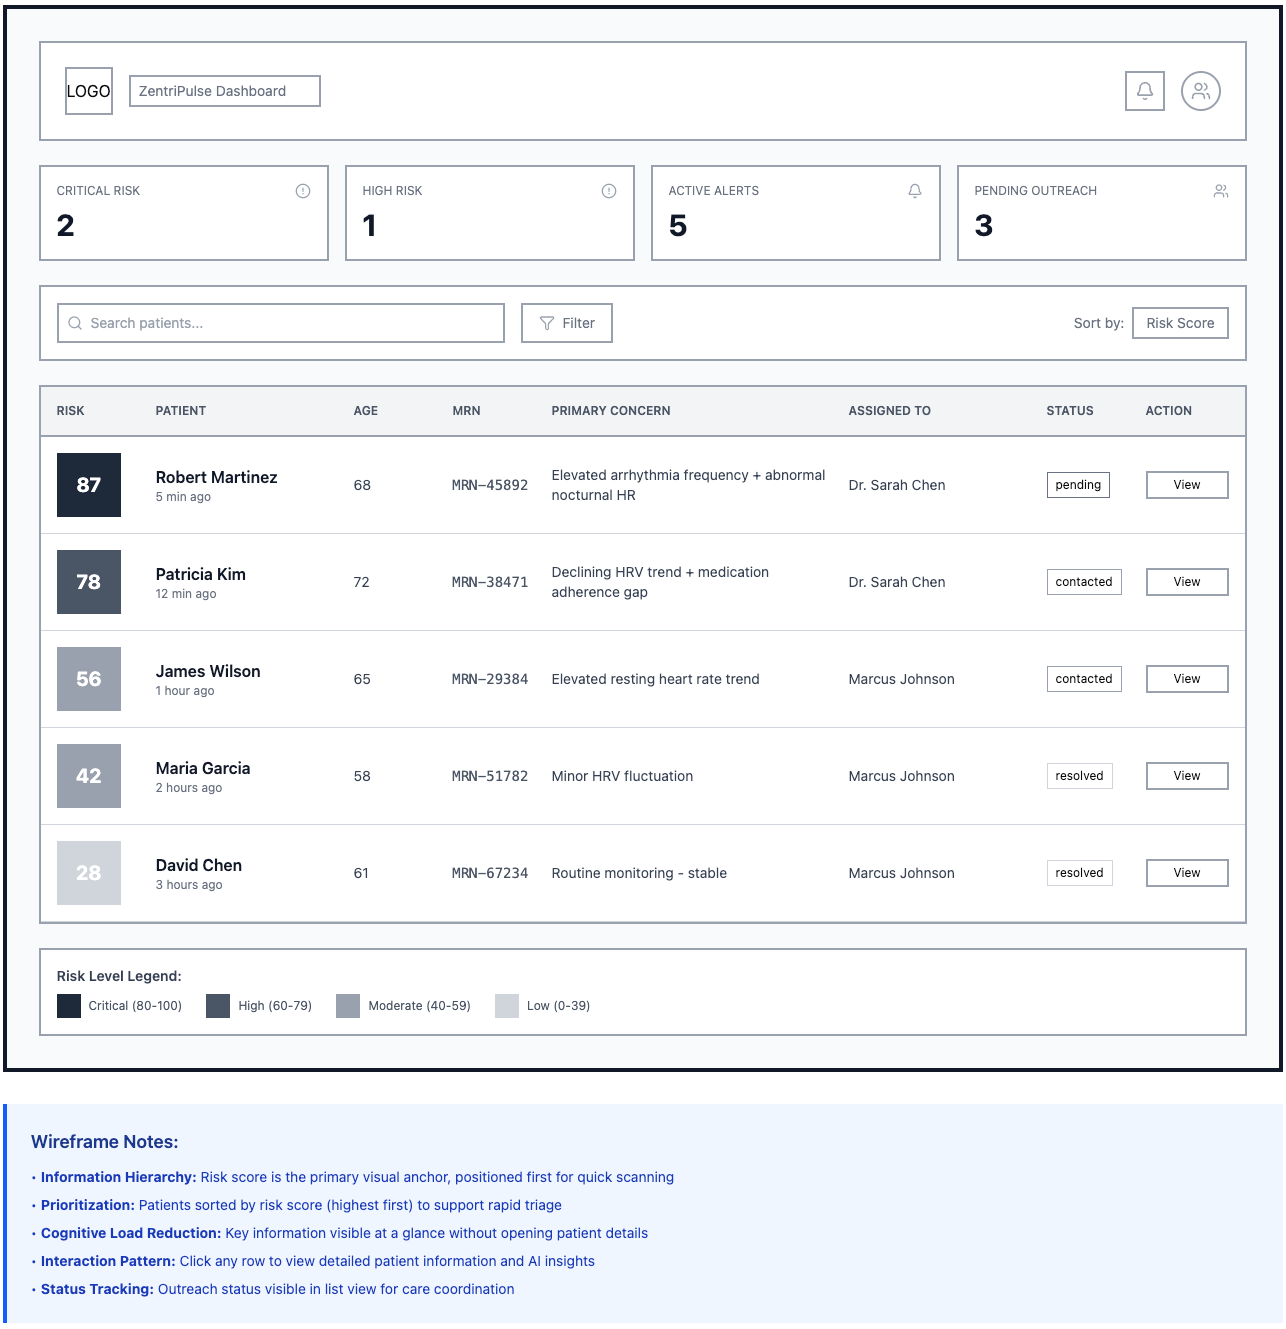
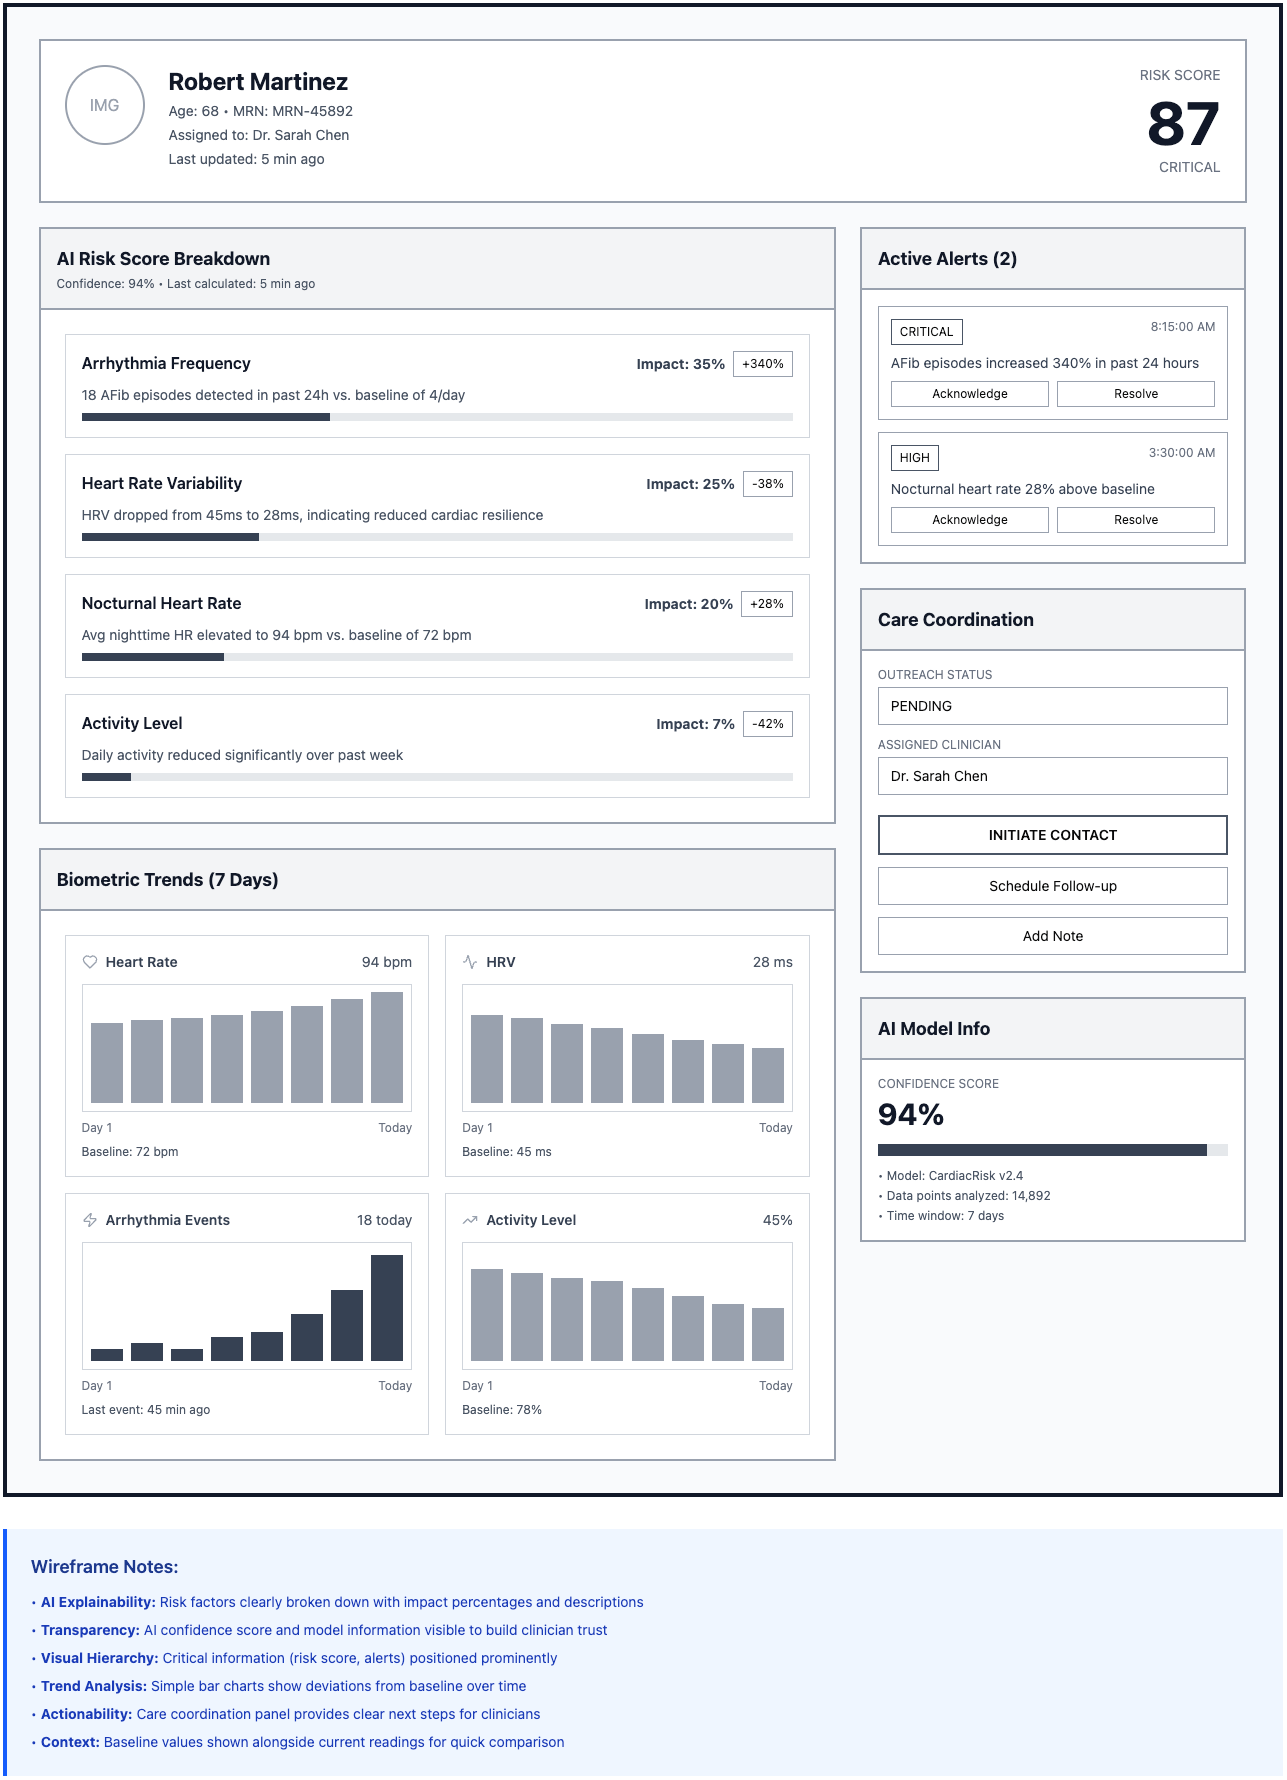
High-Fidelity Wireframes
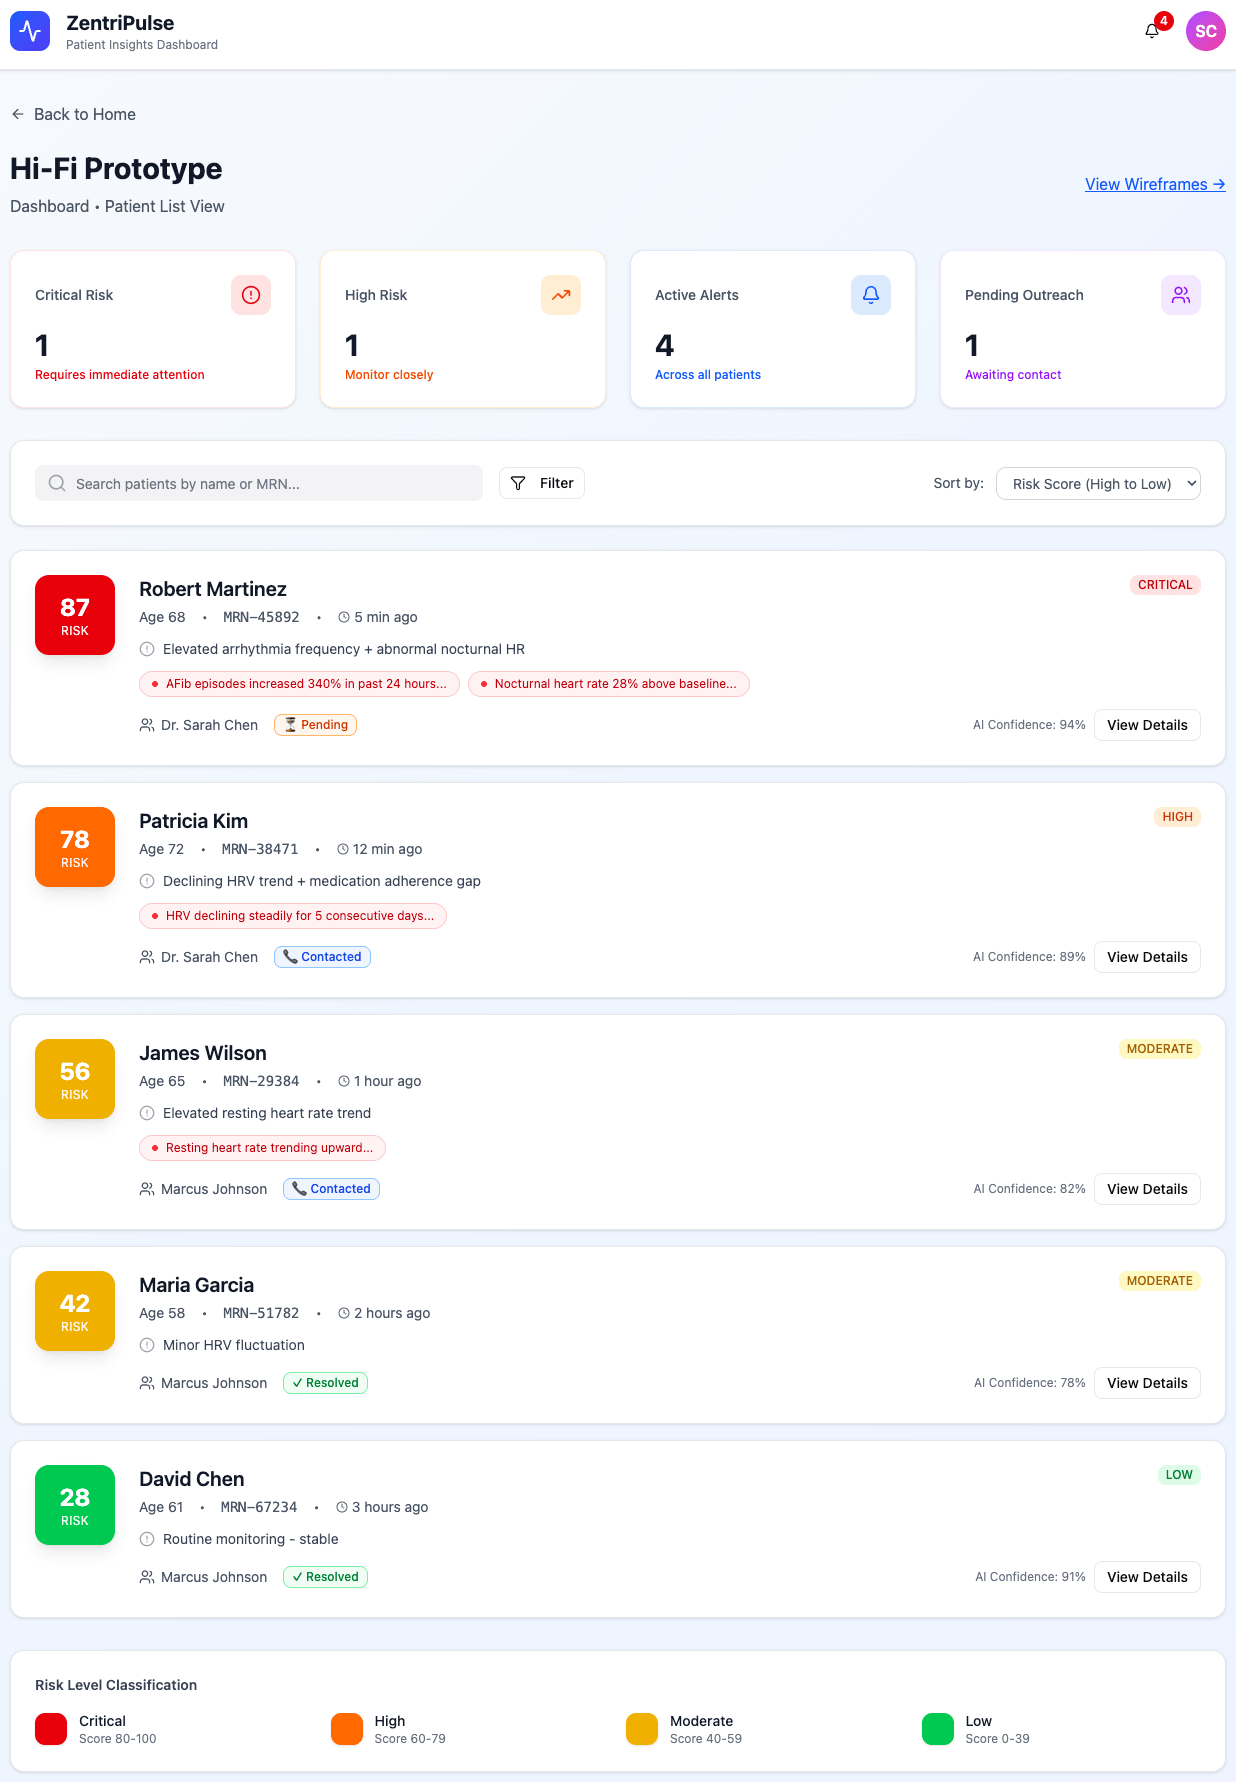
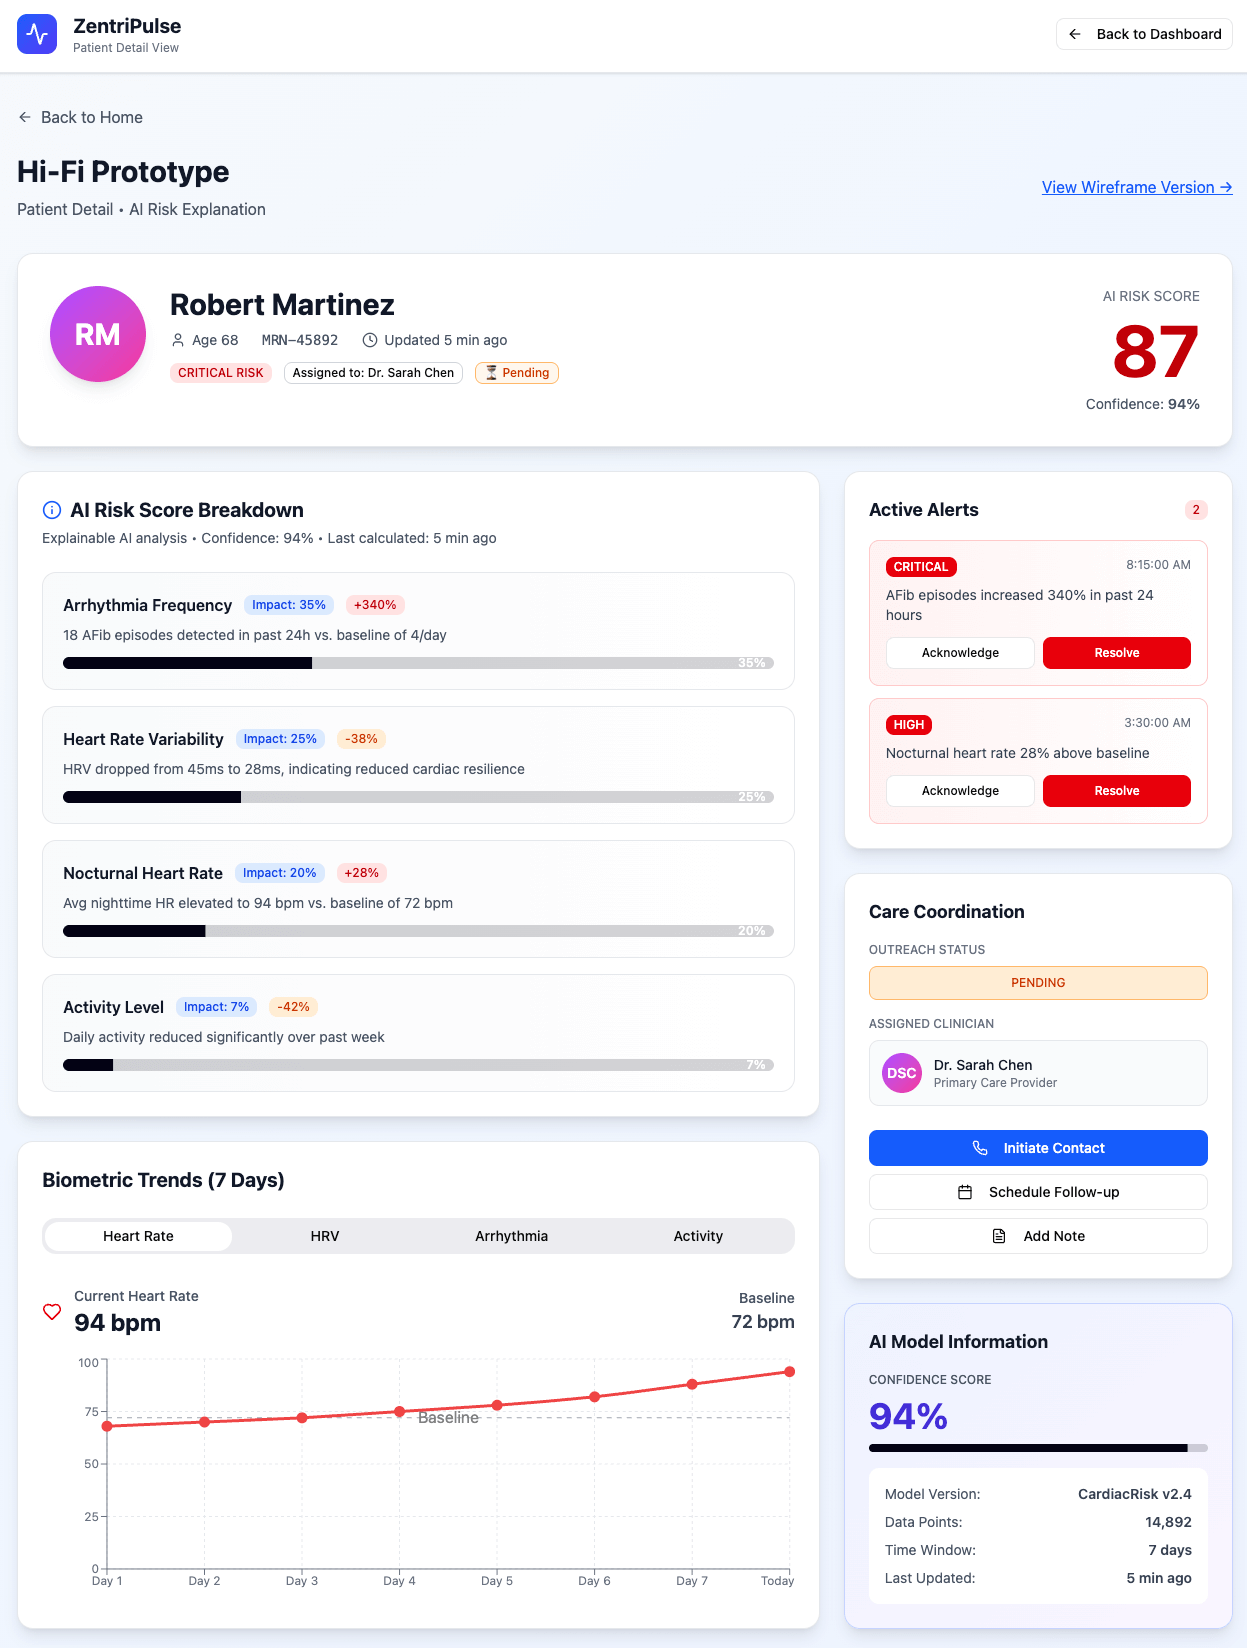
High-Fidelity Prototype
View ZentriPulse high-fidelity prototype
Key Takeaways
AI-Assisted Design: An Important Note of Caution
The journey maps shown earlier were the third attempt from Figma Make. Below is the first attempt. I found the format of these journey maps hard to follow. Each persona has an emotional journey consisting of a row of five items across the top, and below that is a column of five sections containing the rest of the data, with each section of the column corresponding to the respective item in the emotional journey row.
Journey Maps v1 as a downloadable PDF
I instructed Figma Make to reformat the journey maps in a such a way that the data corresponding to each point of the emotional journey is arranged in a column below it so the entire journey could be read one column at a time from left to right. The next attempt was like the final attempt, but Marcus Johnson’s green fill for his header was missing, so the header was white text on a white background. I instructed the AI to put the green fill back in, and the final attempt resulted.
This goes to show that while AI can be a powerful collaborator, a human designer with knowledge and insight is still needed to check the AI’s work and prompt it in the right direction.
